How to Use the FinViz Stock Screener To Find Top Dividend Stocks

One of the best financial screeners that I currently use is the Finviz Stock Screener. Finviz is the site where I track my portfolio and generally begin my stock research.
While it has limitations for dividend investors such as myself, I find it to be an excellent place to begin the search for dividend investing opportunities.
In this post, I will guide you step-by-step through how I use the FinViz stock screener in my every day investing.
If you like, you can also check out the video I created on utilizing the screener as well:
Why Use The FinViz Stock Screener?
I discovered FinViz early on in my investing career and have used it ever since.
I find that its tools are easy to understand and in particular, the screener is one of my favorites. Why should you use it? Here are my top reasons to use the FinViz Stock Screener:
Reason #1: Great for Portfolio Management
I really like the FinViz portfolio feature. I’m a minimalist by nature, so the fact that I can have all of my positions, in one spot, without the need to click through screens or look through charts is very appealing to me.
I track my portfolio in various locations, but FinViz is my typical go-to for reviewing the +/- gain on my portfolio.
Reason #2: Simplicity
FinViz is easy to use. There is certainly a lot of data, but I find that it is organized in such a way that I know where the information is located.
Using simply designed tools like this is very important to me.
Being in the web design business, I have understood how important it is for users to have simple navigation through data, screens, etc. In everything I do, I think about the UX behind the build.
The builders of FinViz.com thought about this as well. Once you come to understand the tool, it is very easy to use.
Reason #3: Easy to Understand Screener
As discussed above, simplicity is built into the entire site, so it is much easier to use.
The screener contains much information, but once the user understands how to filter correctly, it becomes a powerful, simple tool for the everyday investor.
Simple Investing Now Available!
Want to learn the dividend investing strategy? Learn the ins and outs of how to invest in dividends to grow your passive income!
Basic Intro to FinViz.com
The Home Screen
Upon arriving at FinViz.com, you are greeted with the home screen.
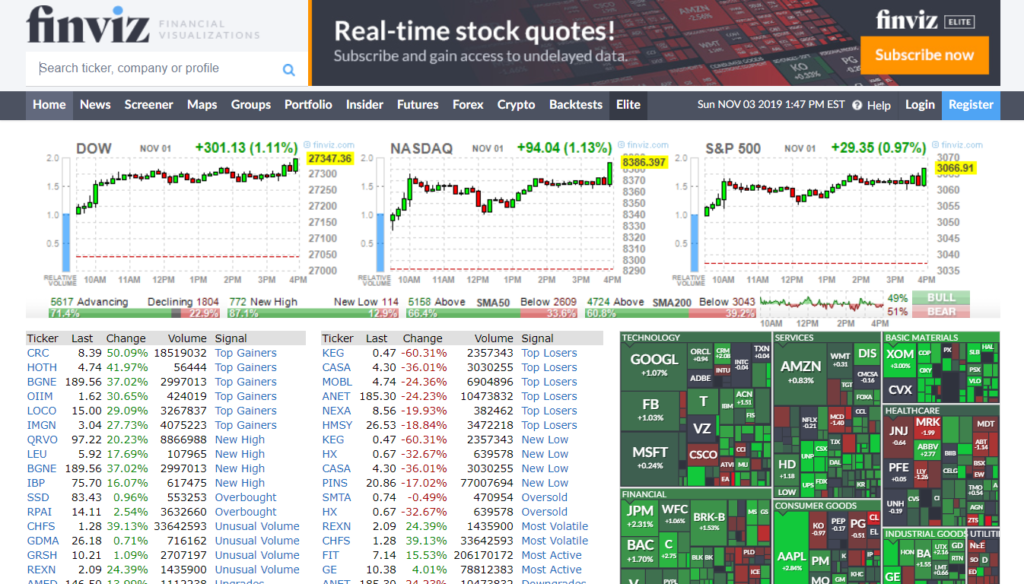
Here you will find the starting place to find awesome stocks.
This is your basic intro screen complete with:
- Search Bar
- DOW, NASDAQ, S&P 500 daily charts
- Top Gainers & Losers for the day
- Stock Map
- Major News
- Top Insider trades
From this screen, I typically look at the stock map, complete a search for a ticker, or utilize the screener.
First we’ll look at the Stock Map and how I use it in tandem with the FinViz Stock Screener.
Stock Map
In the stock mapping tool, we can see how various stocks and sectors are performing for any given day.
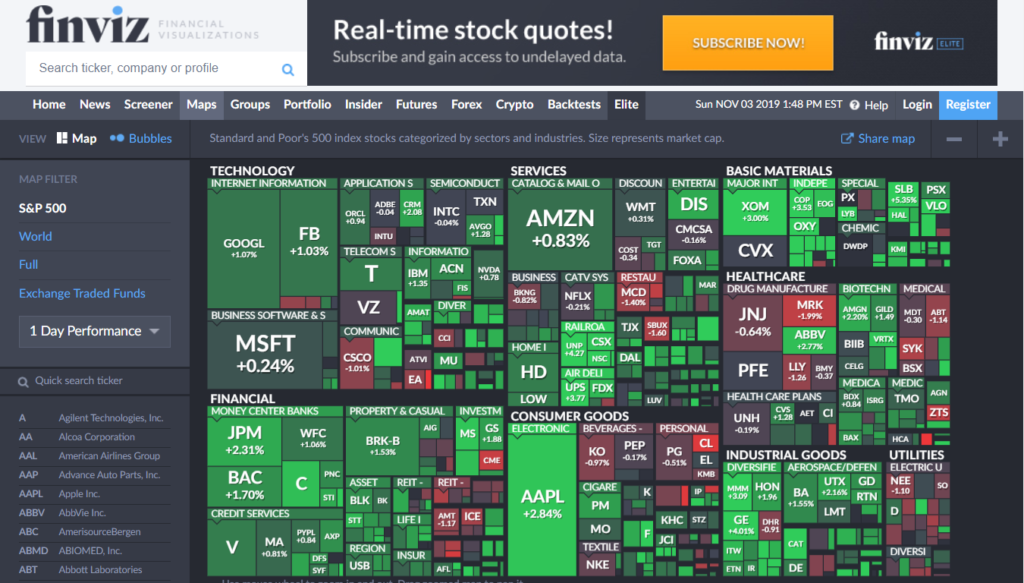
I like this map, as it provides me a good visualization of the overall performance of various sectors.
A big plus is that we can click through on a particular stock and get the data on how the industry as a whole is doing.
Below I see that 3M ($MMM) is trending up, so I decided to hover over the stock:
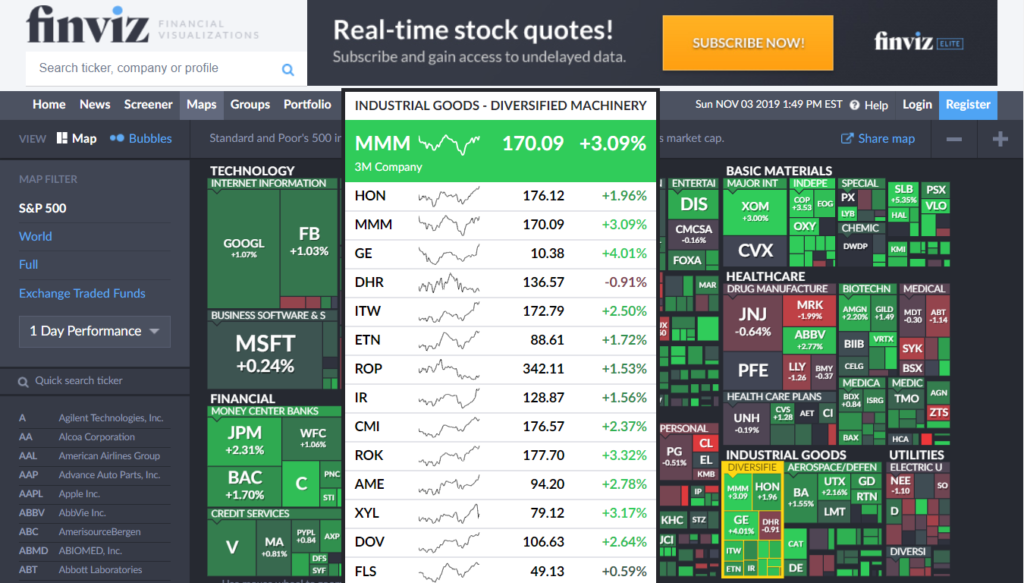
Not only does it bring up MMM’s latest performance, but it also shows how the ‘industrial goods – diversified machinery’ is doing as well.
This data can be helpful to me as it can show general trends or if one stock is performing particularly well in a certain sector, I can note to dig into that a bit further.
Utilizing the Search Bar Feature
This search feature is so helpful to me in my stock analysis. More often than not, this is my go-to place when I begin a stock search.
Simply plug in a ticker symbol and FinViz will bring up a listing of stocks associated with that symbol.
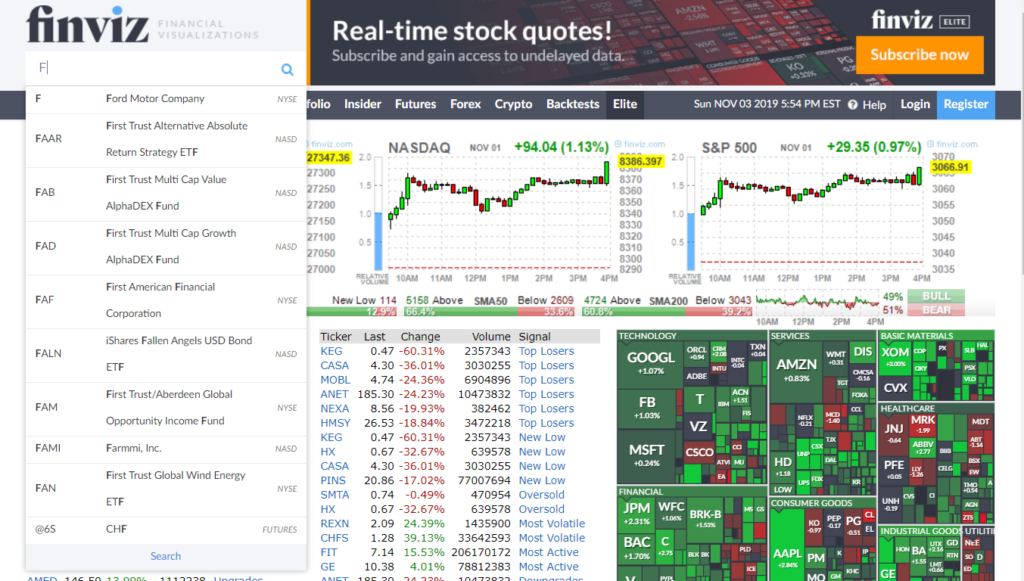
From here, we can click through on the Ford selection to go to more detail on the stock.
There are three main sections on the individual stock screen:
Section #1: The Stock Chart
The very first section of the individual stock analysis is what you’d expect to see: the stock chart.
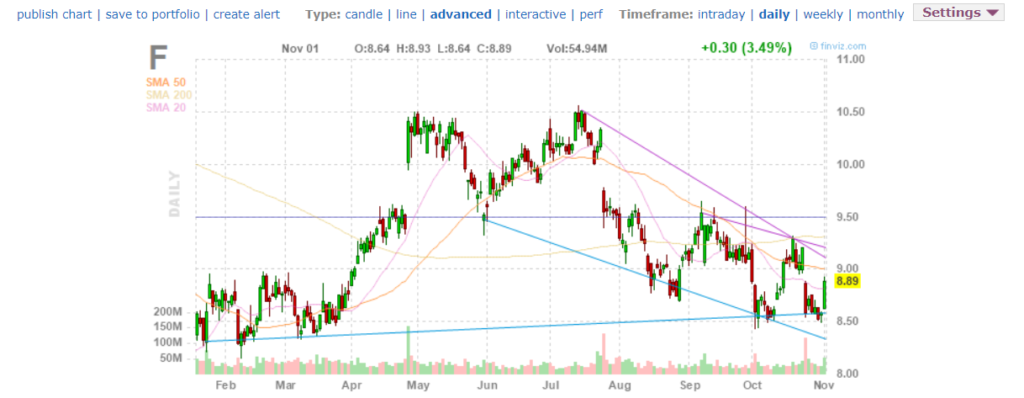
Pros:
- The chart mainly because it is simple to understand.
- The chart also has candlesticks and trend analysis. While that is used more in day trading, I do utilize those as FYIs in my very own trading style as well.
Cons:
- Though you can change the FinViz chart to daily, weekly, or monthly intervals, it’s not as interactive as some other charts I use. It seems to be based on older technology that is not interactive. Perhaps they’ll change that someday as that’s the biggest knock I have against it.
Section #2: The Fundamentals & Analyst Opinions
The next section is the fundamental analysis of the stock and analyst opinions:
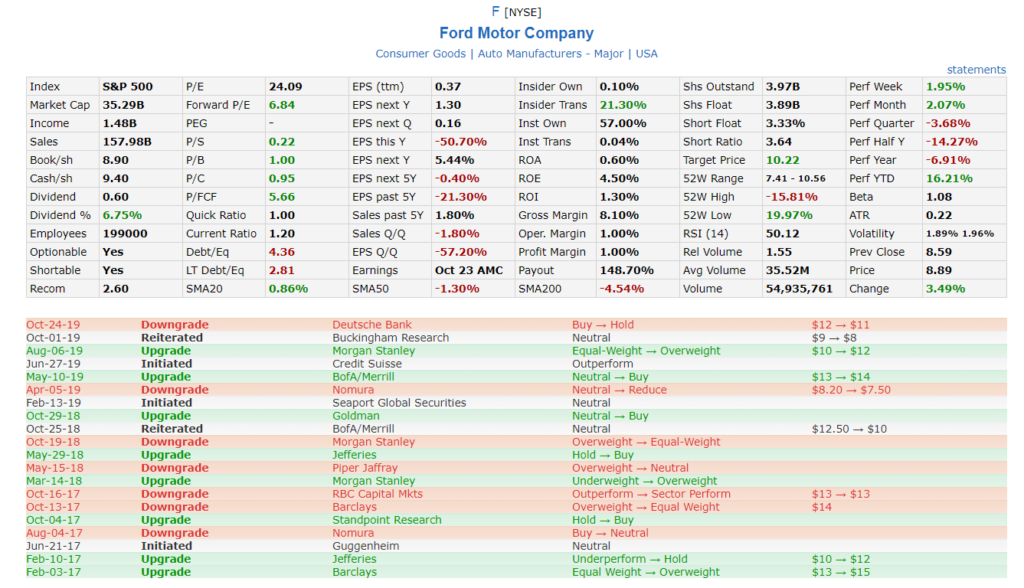
I spend much of my time here. I like to pore over the numbers to ascertain a quick overview of how the particular stock has been performing.
Once you become well-versed in this screener, you will be able to quickly see the information you are looking for.
Here is what I’m typically targeting when completing a quick overview:
- Market Cap – This helps me see the relative size of the company
- Dividend % – This provides me a quick glance at the dividend yield
- Price/Book – How valuable the company is from a tangible asset perspective
- Quick & Current Ratio – How well capitalized the company happens to be
- Debt/Equity – The relative leverage of the company
The next section is the analyst’s opinions. I take these with a grain of salt, but it is an interesting exercise to see if the current opinion is bullish, bearish, or mixed.
Often times I will take the opinions and categorize them in the back of my mind as an FYI. If the stock is recently in favor, I try to figure out why. The same thing goes if analysts are betting against a particular stock as well.
Knowing the analyst’s price targets is certainly an interesting proposition can be of benefit for investors as well.
Section #3: News & Insights
The last part of the individual stock page is the news and insights section.
This might not be the most important to my analysis procedures, but it is certainly my personal favorite. This is because it draws in the latest articles from news organizations and the latest opinions from Stocktwits.
It can be entertaining to read through Stocktwits to see what individuals are saying about particular stocks. Sometimes it is good, actionable information; other times it is just jibberish from bots.
The thing I am looking for are interesting tidbits that I might not have been aware of before or that give me something interesting to dig into further.
Want to Learn Active/Passive Income and Investing Strategies?
Sign up for our Live Free and Div Hard email list to receive exclusive ideas and tips straight to your inbox!
Guide to Using The FinViz Stock Screener
Ah, here we are now. The beautiful FinViz Stock Screener. In this section, I’ll take you through a guide on how I use the screener to find excellent dividend stocks.
While I don’t utilize this screener as much as I used to, mainly because I’ve built out my own custom screening tool, I do come here from time-to-time as I still really like their features.
The FinViz Stock Screener Overview
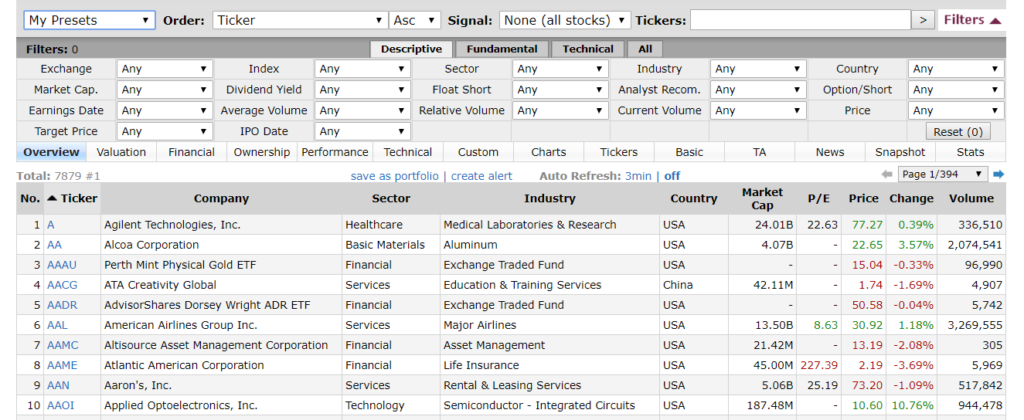
On first glance, this screening tool can seem a bit complex and scary.
One can seemingly become overwhelmed by data, filters, and sub-filters.
However, once you reach a point where you know what strategy you utilize in finding stocks, then the filtering process becomes much easier.
Engage Filters
The first step I do is to engage my filters. While there is a lot of data, I take my 6 dividend investing criteria and apply those to the filters.
Here is what I apply:
Filter #1: Market Cap: $10B+
First, we want to filter by market cap. By clicking on the dropdown, you get various options:
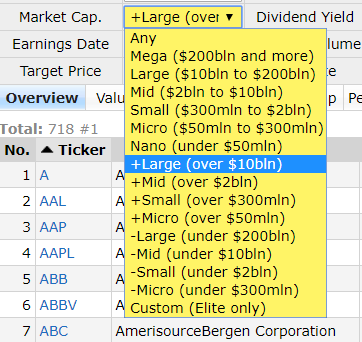
Now, we can use some flexibility with regard to market cap. I have and often do sort with lower criteria, namely the $2B+ market cap filter.
It would be challenging to go below the $2B market cap mark though as I believe those stocks are inherently riskier and could end up cutting its dividend.
A good rule of thumb to begin with is to start with higher market caps (i.e. more established companies) to see if we can we can find values.
If we struggle to find values at the high market caps, we can always throttle down to lower market caps. Continue to keep in mind that often our risk goes up as we decrease in market cap size!
Filter #2: Dividend Yield: 3%+
The second criteria we want to filter by is dividend yield:
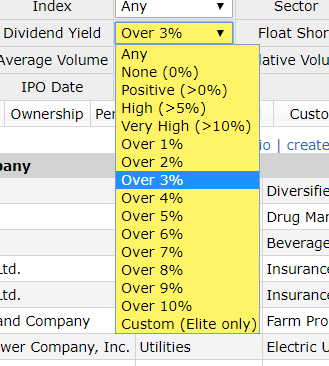
Once you utilize the 3%+ dividend yield, many stocks will be filtered out. This includes many solid companies which do pay a dividend.
Stocks under the 3% dividend yield can still be good buys, but for me, the 3%+ oftentimes represents a good ‘sweet spot’ which can demonstrate a well-valued stock.
We can ratchet this filter down below 3% if needed to find more stocks for investment, but doing so may bring up stocks are a bit more overvalued at the moment.
Anything above the 3% yield would trim the results and yield a more refined set of risky investment plays.
Just remember to practice the dividend investment risk spectrum strategy!
Filter #3: Country: USA
The last criteria we will filter by in this initial screen is country:
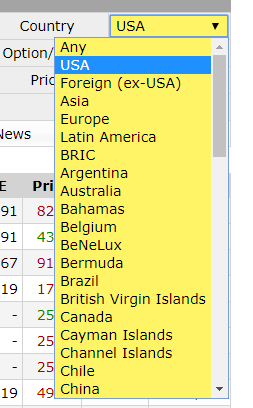
Currently, I personally target stocks on the USA market. In fact, most of my dividend portfolio is made up of companies in the US.
This is because I understand the markets, tax implications, and how to do business in the US.
You can pick whatever country you desire; it’s all based on personal preference.
Keep in mind that there are times when it is advantageous to invest outside of our country of origin. The most important thing is to understand the implications of doing so!
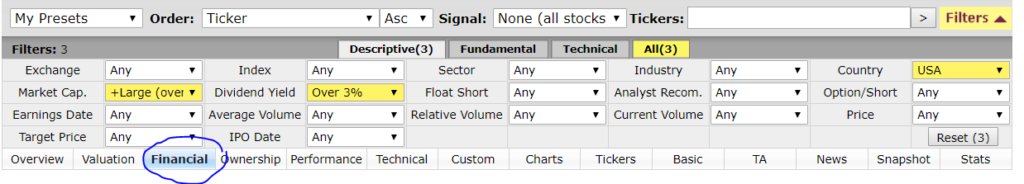
Check-in: The FinViz Stock Screener Dividend Filters
If you applied your filter’s correctly, your screener presets should now look like this:
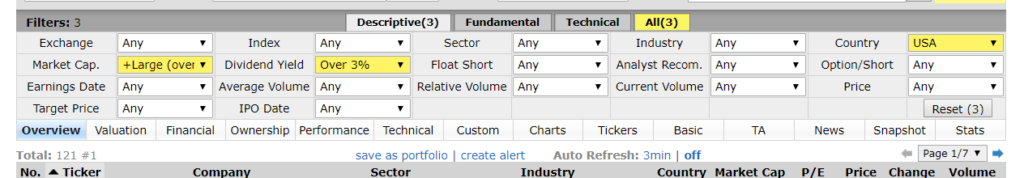
Before we go any further, now is the time when we want to save our filters!
Save Your Filters
ProTip: Remember to save your presents for quicker filtering in the future. Simply create an account at FinViz and click the ‘Save Screen’ drop down option.
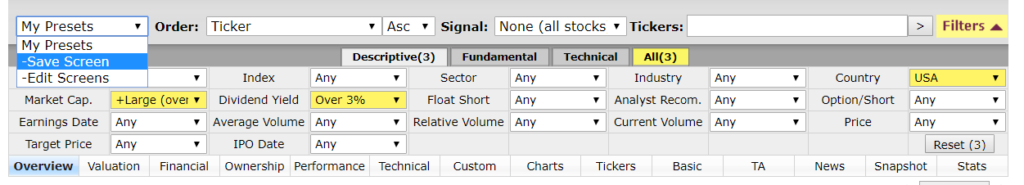
Next time that you log in, you can simply click the drop-down arrow on the ‘My Presets’ tab and your saved preset will be available for use!
Filter #4: Debt / Equity (Optional)
There is one more filter that I assign at times which I include here as optional.
Since I typically target companies with low debt/equity ratio, it makes sense to apply the filter for this category when I am seeking more risk-averse investment plays.
To do this, we’ll need to head over to the fundamentals section of the screening tool. Simply click on the ‘Fundamental’ tab up top:
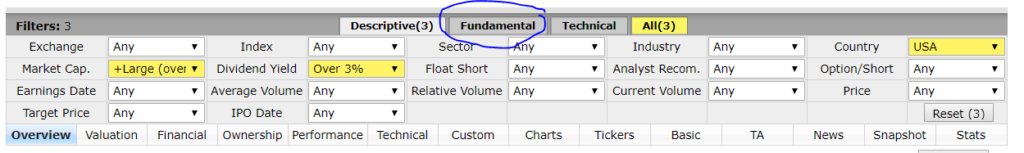
Once you do this, you’ll bring up the fundamental filter options shown here:
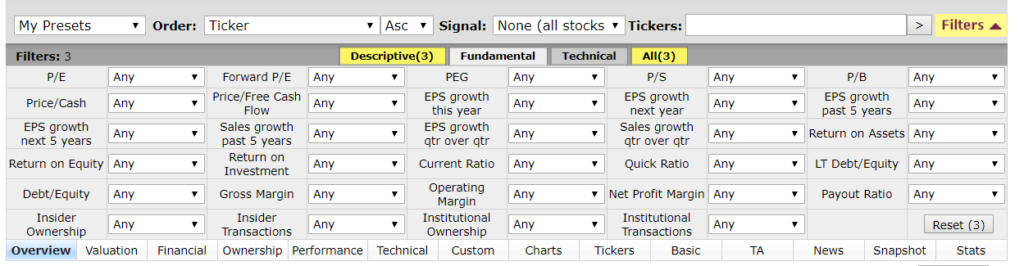
There are many different items you can sort by on this tab. You can play around with the filters, but we’ll simply apply the debt/equity ratio of less than 1x.
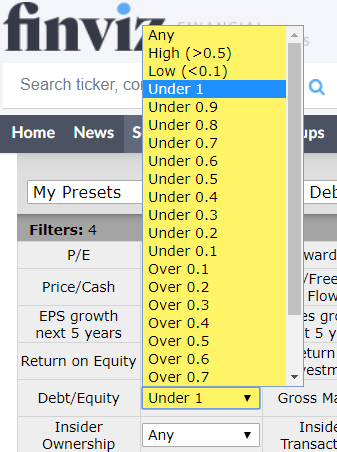
This will further trim our results to focus on those companies carrying very little debt relative to equity.
In this instance, our results go from 121 companies down to 46. We want to be a bit careful at times in selecting this debt/equity filter as doing so can have a large impact on the number of companies that are displayed.
Apply Sorts
Once we have our filters in place, it is now time to sort the data.
Here we can get creative. There are many ways to identify stocks ripe for investing. I will show you some of my favorite ways to sort.
Before we get started, a quick note that to sort the data, we simply click on a header field in the data section.
We can sort in two main fashions:
- Ascending – increasing in size (bottom-up, lowest values first)
- Descending – decreasing in size (top-down, highest values first)
It’s important to know your reasoning for the sort in order to adequately configure the data to display what you’d like to see.
My Favorite Sorts
Here are some of my absolute favorite FinViz Stock Screener sorts!
Sort #1: PE Ratio
The first sort that I do is by PE Ratio in ascending fashion:
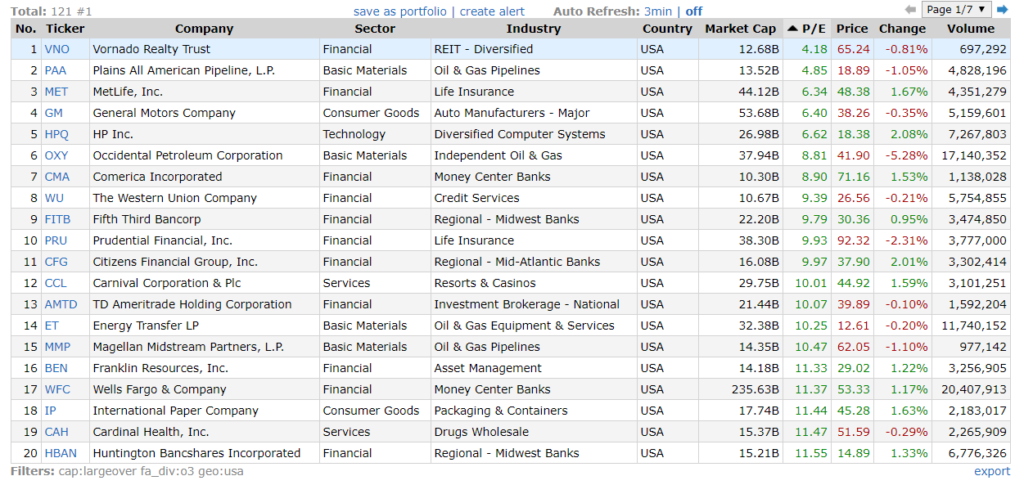
What I’m looking for here are potentially undervalued dividend-paying stocks that are ripe for investment.
As our financial definitions page can tell us, the PE ratio is a valuation metric. It tells us how much each share price is trading for relative to the earnings (profit) of the company.
The rule of thumb is the lower the PE Ratio, the better the valuation.
We have to be careful here though as the PE ratio can be deceptive at times. It can be lower for various reasons, namely the fact that there are accounting reasonings for the number we’re seeing.
The trick is to use the PE ratio as a tool, not as gospel.
When we combine the PE ratio with other metrics we are reviewing, we will be much more apt to understand whether the PE ratio is justified.
Sort #2: Price
The second sort that I typically complete is by Price (lowest to highest):
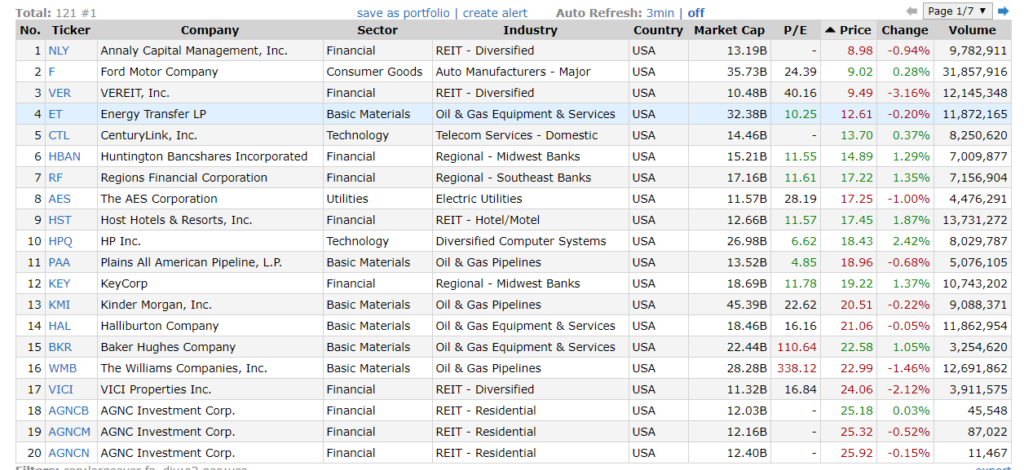
The main reason why I like to sort by price in ascending fashion is that it helps to provide me insights into stocks that I can achieve massive share accumulation through DRIP.
All things equal, in buying lower-priced stocks, I am on a much quicker road to building my annual dividend income.
However, keep in mind that the rule of thumb is the lower the stock price, the higher the risk.
Therefore, we want to ensure that we are buying into companies that, even though they have lower stock prices, they will be paying dividends well into the future.
We can do this via our price sort by moving beyond price and taking into consideration many other factors such as capitalization, debt ratios, cash flow, etc.
Next: Change Our Tab
For the previous few sorts, we were on the ‘overview’ tab.
The next few sorts require us to change our current tab to the ‘financial’ tab shown here:
Once you have changed tabs, we can go ahead and finish our sorts!
Sort #3: Dividend Yield
The next sort that I find beneficial to complete is sorting by dividend yield in descending order:
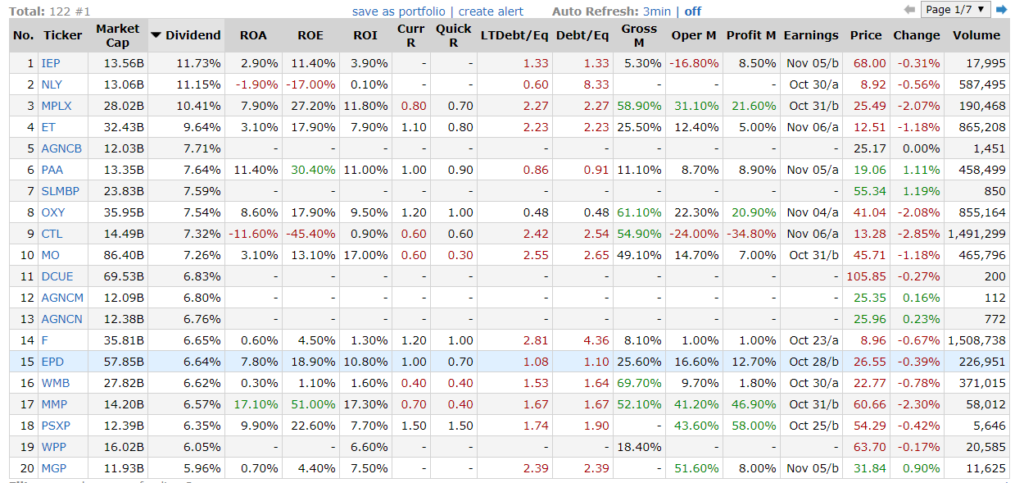
By completing this sort, I am able to find out which companies are yielding the most from a dividend % in order to maximize share accumulation.
Here again though, we have to exercise caution as there are reasons why stocks are paying a higher dividend.
The rule of thumb again is the higher the yield, the higher the risk.
In our article, 6 Investing Tips for the Long-Run, we cautioned investors against the prospect of chasing yield.
Our due diligence analysis will help to find those stocks with the solid cash flows needed to sustain the dividend payment.
Sort #4: Debt/Equity
The next sort is by debt/equity. This sort is interesting in that it can be done in both ways – ascending or descending – in order to get different reads.
Typically I find myself sorting in ascending fashion, which means I’m keying in on stocks that have low debt/equity ratios:
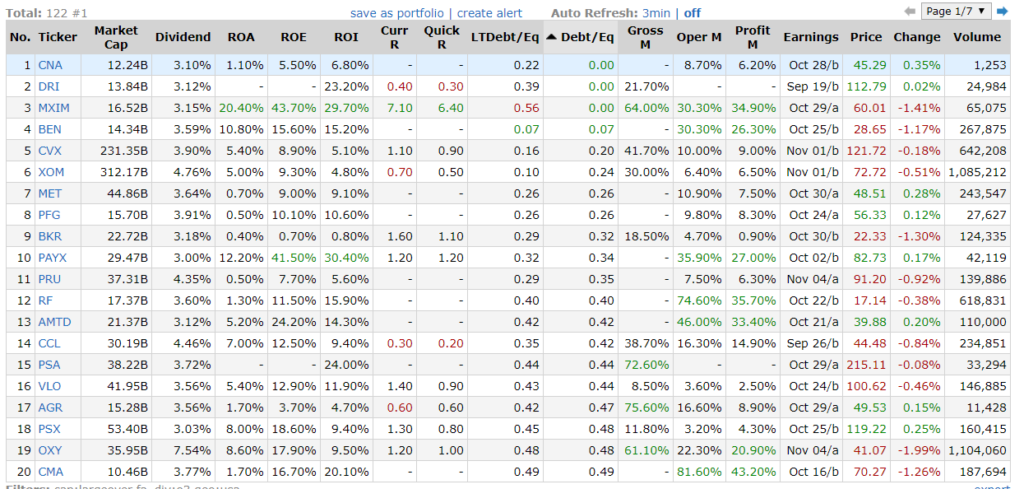
By keying in on companies that have low debt/equity ratios, I am hoping to find well-valued companies that operate with manageable debt.
I am not diametrically opposed to debt as a way to grow a business, I just do not want to see debt being used as a ‘crutch’ for a cash-flow negative company to sustain its operations.
An ideal situation is if a company has routinely positive cash flows and utilizes low-interest debt to help grow return on investment (ROI).
In targeting stocks that have a lower debt/equity ratio, I’m also better protecting my dividend payment. This is because companies that take on too much debt become beholden to creditors instead of shareholders.
If too much debt is taken on, the company could run into a tough situation during down markets where the dividend might be unsustainable with high interest and principal payments due to creditors.
This sort helps bring all of this into light and shows me dividend-paying companies that operate with little-no debt and likewise, those that operate with significant debt.
All things being equal, I would much rather invest in companies with lower debt ratios.
Summary: FinViz Stock Screener
In summary, I find that the FinViz Stock Screener is an excellent tool that has helped me in my investing journey.
While I don’t use the screener as much as I used to mainly due to building out my own screener, I still do use it from time-to-time for a different look.
FinViz does remain my go-to spot to review my positions as I really enjoy its easier to understand interface and simplicity built-in throughout its site. It’s a minimalists dream!
Do you use FinViz.com? Why or why not? What screening tools do you use to find great dividend-paying stocks? Comment below and get the conversation started!
Want to Learn Active/Passive Income and Investing Strategies?
Sign up for our Live Free and Div Hard email list to receive exclusive ideas and tips straight to your inbox!
Disclosure: I am/we are long $AAPL, $ADM, $BG, $BP, $BUD, $CALM, $CAG, $CAT, $CMI, $CTL, $DAL, $F, $FAST, $GE, $GT, $HBI, $JNJ, $IBM, $INGR, $KHC, $KO, $KSS, $MMM, $NWL, $PFE, $PG, $SBUX, $SJM, $SPTN, $STX, $T, $TSN, $UPS, $WFC, $WPC, $WRK, $WY, $XOM
Disclaimer:(1) All the information above is not a recommendation for or against any investment vehicle or money management strategy. It should not be construed as advice and each individual that invests needs to take up any decision with the utmost care and diligence. Please seek the advice of a competent business professional before making any financial decision.
(2) This website may contain affiliate links. My goal is to continue to provide you free content and to do so, I may market affiliates from time-to-time. I would appreciate you supporting the sponsors of MoneyByRamey.com as they keep me in business!