
The Dividend Stocks Watchlist
Welcome to the newest tool in the MoneyByRamey.com Financial Freedom seeker's toolbelt: the Dividend Stocks watchlist.
This list is created from our proprietary trading models and available to you to help in your journey towards finding great dividend stocks via the dividend investing strategy.
With nearly 700 dividend-paying stocks for you to choose from, this list is meant to be a one-stop-shop for you in selecting dividend stocks.
By using this model on a daily basis, I have personally been able to build my dividend portfolio to 50+ positions to $8,400+ in yearly dividend income!
NEW! You can now download this list to use for your own sorting purposes. Simply click on the 'Download the Dividend Stocks Watchlist' below.
Using the Dividend Stocks Watchlist
This list below is live data (with a slight delay) and is available for your use. My goal is to publish this list as a downloaded csv file 1x/ month in case you'd like to do your own sorts or analysis.
The list is sorted by the Ramey Rating.
Here is a snapshot of the data included in this list:
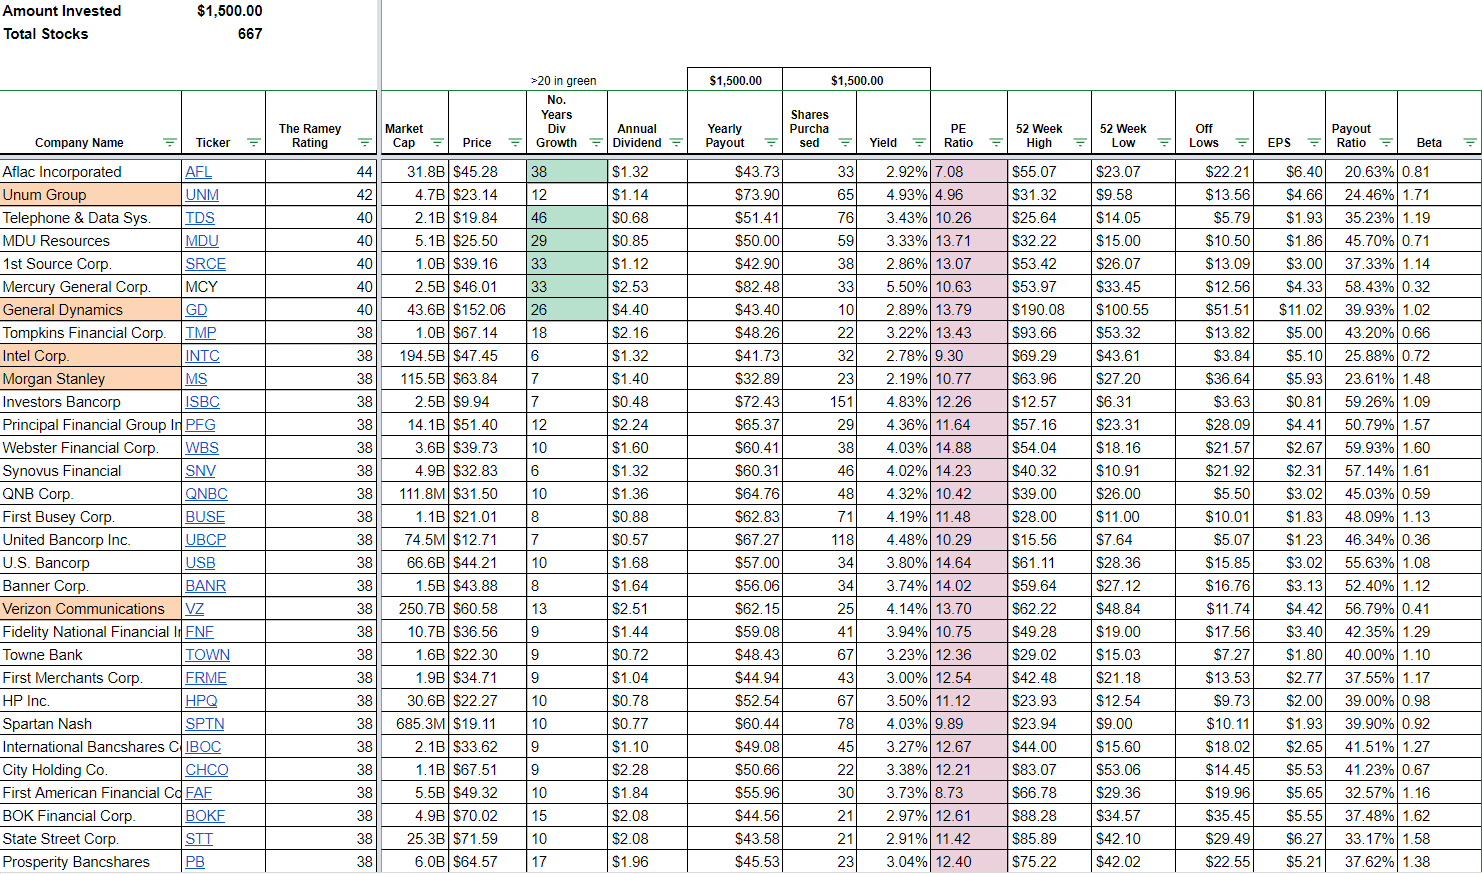
Data Field List Summary
- Company Name: Name of the company
- Ticker: Publicly-traded ticker symbol
- Market Cap: The total market cap of the company - calculation: (share price * outstanding shares)
- Price: Current price of the stock (delayed by 20 min)
- No. Years: Number of years the company has been increasing its dividend payment.
- Annual Dividend: The most recent dividend payment.
- Yearly Payout: The annual dividend payout amount.
- Shares Purchased: Number of shares you would purchase at a particular price point. This model will always assume $1500.
- Yield: current % dividend yield.
- PE Ratio: Current price/earnings ratio.
- 52-Week High: The highest price the shares have traded for in the past 52 week time period.
- 52-Week Low: The lowest price the shares have traded for in the past 52 week time period.
- Off Lows: The level that stocks are trading from their lowest 52-week price point.
- EPS: Earnings per share.
- Payout Ratio: The amount that stocks are paying in dividends when compared to the latest earnings per share.
- Beta: The volatility of a stock. The higher the beta, the more assumed risk.
- The Ramey Rating: This is a valuation metric that I have developed to help identify stocks that might represent decent value positions for investment. The list is sorted off this criterion. Note that this rating doesn't reflect financial strength, only potential value. Interested to learn more about the Ramey Stock Rating?
Recommended Sorting/Filtering of the Data
I personally use this table to find the best dividend stocks available. Head over to the 6 Dividend Investing Criteria I use if you want a full analysis of the criteria. To best use the information presented in this list, I recommend the following data sorts for this watchlist:
- Yearly Payout: Allows you to see how much you would earn from each dividend stock from an annual dividend income perspective. Remember, the values on this list assume a $1,500 initial investment.
- Shares Purchased: Allows an investor to focus on how many shares you are initially purchasing. As a general rule, the more shares you purchase = the greater the share accumulation possible, which means faster annual dividend income growth through DRIP.
- PE Ratio: This is a value metric that will help you find potential value plays. By sorting this column from lowest to highest, I am able to see stocks that have a generally low price when compared to what the company was able to bring in via EPS.
- Off Lows: This column helps me identify potential value plays. If a stock is at or barely above its 52-week lows, the market is beating the dividend stock up for some reason and it could indicate a possible investment opportunity.
Table Notes
- The values in this table assume a $1,500 initial investment.
- A payout % ratio has been added.
- This is best viewed on the desktop - simply zoom out to see more of the table.
- The data is presented as-is. It is up to each investor to confirm that the data is displaying correctly. If you do notice any errors in the data, please email webmaster@moneybyramey.com and we'll troubleshoot right as soon as we can.

Investing is the vital first step towards Financial Freedom. Learn the ins and outs of investing with Simple Investing.